Sonntag, 23. Dezember 2018
Meteorological report for October (Maribor)
beekids, 22:14h
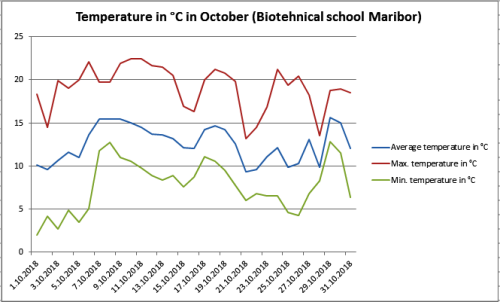
The pleasant weather continued in October. The average temperatures were constant at that time. The downward trend in rainfall continued.
The difference between the highest (October 10 and 11) and the lowest (October 1) measured temperature in the month was 20.4 °C. This is a surprise, given the constant temperatures this month.
The average monthly temperature was higher than the average of the period from 1981 to 2010 – it was 12.6 °C, and it was 1.90 °C higher than the long-term average. The long-term average for October is 10.7 °C in Maribor. The average temperature was in the range of 10 to 15 ° C for a whole month. The difference between the average temperature of the coldest (October 21) and the warmest (October 29) day was 6.26 °C. The differences between night and day temperatures, were up to 17 °C, which is less than in the previous months.
In October, the daily average temperature was eight times below the average of the period from 1981 to 2010 (10.7 °C). The maximum temperature was thirteen days between 20 and 23 °C, and only four days below 15 °C. The lowest temperature in October was 2 °C, and the highest temperature was 22.4 °C. In the first ten months, the average temperature was 1.02 °C higher than the long-term average. In the last month, the average temperature increased by 0.10 °C in relation to the long-term average.
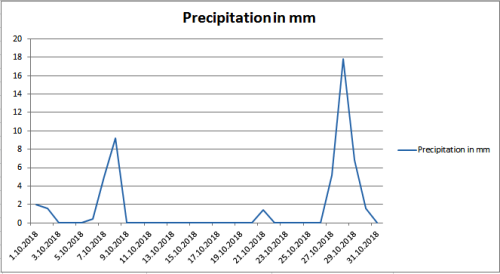
Precipitation data show that there was very little precipitation in October, which has been going on for the last five months. In October 65,4 % of the precipitation dropped, as is the long-standing average. The measuring device detected 51 mm of precipitation, which is much less as long as the long-term average (78 mm of precipitation). In the first ten months, 49.4 mm less precipitation fell than the long-term average. In the first ten months we recorded as much as 136 precipitation days, almost half of all days (44.7 %).
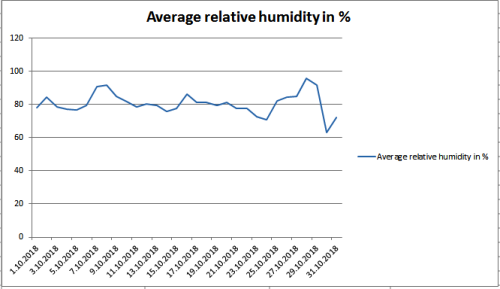
The average relative humidity in October was 80.53 %, which is slightly more than in the months before. According to cold night, this was expected.
The difference between the highest (October 10 and 11) and the lowest (October 1) measured temperature in the month was 20.4 °C. This is a surprise, given the constant temperatures this month.
The average monthly temperature was higher than the average of the period from 1981 to 2010 – it was 12.6 °C, and it was 1.90 °C higher than the long-term average. The long-term average for October is 10.7 °C in Maribor. The average temperature was in the range of 10 to 15 ° C for a whole month. The difference between the average temperature of the coldest (October 21) and the warmest (October 29) day was 6.26 °C. The differences between night and day temperatures, were up to 17 °C, which is less than in the previous months.
In October, the daily average temperature was eight times below the average of the period from 1981 to 2010 (10.7 °C). The maximum temperature was thirteen days between 20 and 23 °C, and only four days below 15 °C. The lowest temperature in October was 2 °C, and the highest temperature was 22.4 °C. In the first ten months, the average temperature was 1.02 °C higher than the long-term average. In the last month, the average temperature increased by 0.10 °C in relation to the long-term average.
Precipitation data show that there was very little precipitation in October, which has been going on for the last five months. In October 65,4 % of the precipitation dropped, as is the long-standing average. The measuring device detected 51 mm of precipitation, which is much less as long as the long-term average (78 mm of precipitation). In the first ten months, 49.4 mm less precipitation fell than the long-term average. In the first ten months we recorded as much as 136 precipitation days, almost half of all days (44.7 %).
The average relative humidity in October was 80.53 %, which is slightly more than in the months before. According to cold night, this was expected.
... link (0 Kommentare) ... comment
Sonntag, 21. Oktober 2018
Meteorological report for September (Maribor)
beekids, 12:55h
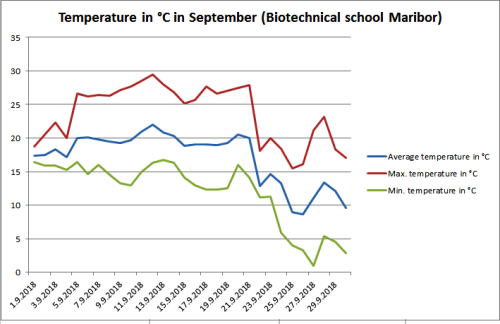
In September, the summer weather continued, which farewell in the last third of the month. The average temperatures were constant at that time. In the last part of the month, temperatures dropped significantly on average. The reducing trend of the amount of precipitation was continued.
The difference between the highest (September 12) and the lowest (September 27) measured temperature in the month was as high as 28.5 °C. This is not such a big surprise, given the very high temperatures in the first part of the month and low in the last part of the month.
The average monthly temperature was also significantly higher than the average of the period from 1981 to 2010 – it was 17.1 °C, and it was 1.50 °C higher than the long-term average. The long-term average for September is 15.6 °C in Maribor. The average temperature in the first two thirds of the month fluctuated slightly but did not change excessively. In the last week, the average temperature dropped by as much as 10 to 14 °C. The difference between the average temperature of the coldest (September 26) and the warmest (September 12) day was 13.39 °C. There were also great differences between night and day temperatures, up to 20 °C, which is more than in the previous months.
In September, the daily average temperature was nine times below the average of the period from 1981 to 2010 (15.6 °C). The maximum temperature was only seven days below 20 °C, six days above 20 to 25 °C, and seventeen days above 25 °C. The lowest temperature in September was 1 °C, and the highest temperature was 29.5 °C. In the first nine months, the average temperature was 0.92 °C higher than the long-term average. In the last month, the average temperature increased by 0.07 ° C in relation to the long-term average.
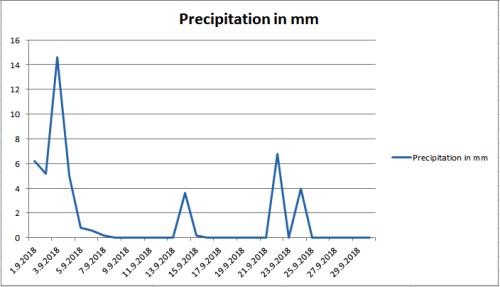
Precipitation data show that there was very little precipitation in September, which has been going on for the last four months. In August, only 47,7 % of the precipitation dropped, as is the long-standing average. The measuring device detected 47.2 mm of precipitation, which is much less as long as the long-term average (99 mm of precipitation). In the first nine months, 22.4 mm less precipitation fell than the long-term average. In the first nine months we recorded as much as 126 precipitation days, almost half of all days (46.2 %).
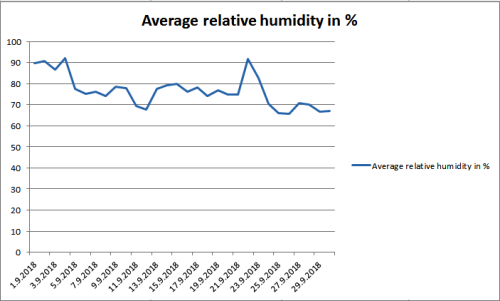
The average relative humidity in September was 76.6 %, which is slightly more than in the months before. According to cold night, this was expected. Therefore, relative humidity, despite high daily temperatures, only six time dropped below 70 %. As a result, molds appeared in the vineyards. Consequently, we had to hurry up with harvesting grapes.
The difference between the highest (September 12) and the lowest (September 27) measured temperature in the month was as high as 28.5 °C. This is not such a big surprise, given the very high temperatures in the first part of the month and low in the last part of the month.
The average monthly temperature was also significantly higher than the average of the period from 1981 to 2010 – it was 17.1 °C, and it was 1.50 °C higher than the long-term average. The long-term average for September is 15.6 °C in Maribor. The average temperature in the first two thirds of the month fluctuated slightly but did not change excessively. In the last week, the average temperature dropped by as much as 10 to 14 °C. The difference between the average temperature of the coldest (September 26) and the warmest (September 12) day was 13.39 °C. There were also great differences between night and day temperatures, up to 20 °C, which is more than in the previous months.
In September, the daily average temperature was nine times below the average of the period from 1981 to 2010 (15.6 °C). The maximum temperature was only seven days below 20 °C, six days above 20 to 25 °C, and seventeen days above 25 °C. The lowest temperature in September was 1 °C, and the highest temperature was 29.5 °C. In the first nine months, the average temperature was 0.92 °C higher than the long-term average. In the last month, the average temperature increased by 0.07 ° C in relation to the long-term average.
Precipitation data show that there was very little precipitation in September, which has been going on for the last four months. In August, only 47,7 % of the precipitation dropped, as is the long-standing average. The measuring device detected 47.2 mm of precipitation, which is much less as long as the long-term average (99 mm of precipitation). In the first nine months, 22.4 mm less precipitation fell than the long-term average. In the first nine months we recorded as much as 126 precipitation days, almost half of all days (46.2 %).
The average relative humidity in September was 76.6 %, which is slightly more than in the months before. According to cold night, this was expected. Therefore, relative humidity, despite high daily temperatures, only six time dropped below 70 %. As a result, molds appeared in the vineyards. Consequently, we had to hurry up with harvesting grapes.
... link (0 Kommentare) ... comment
Samstag, 1. September 2018
Meteorological report for August (Maribor)
beekids, 19:24h
In August, we finally had a real summer. Temperatures raise every day at the beginning of the month. With short interruptions, this was repeated practically until the last week. It is therefore not unusual that August was the warmest month this year. The trend of increasing the average temperature and reducing the amount of precipitation was continued.
The difference between the highest (August 9) and the lowest (August 27) measured temperature in the month was as high as 23.1 °C. This is not a big surprise for August, as it is characteristic that in the second half of the month, night temperatures are significantly reduced.
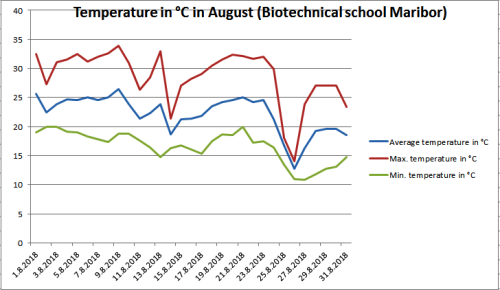
The average monthly temperature was also significantly higher than the average of the period from 1981 to 2010 – it was 22.16 °C, and it was 1.96 °C higher than the long-term average. The long-term average for August is 20.2 °C in Maribor. The average temperature fluctuated slightly in the first three weeks, but did not change excessively. In the last week, the average temperature dropped by as much as 5 to 6 °C. The difference between the average temperature of the coldest (August 26) and the warmest (August 9) day was 13.7 °C. There were also great differences between night and day temperatures, up to 18 °C, which is more than in May, June and July.
In August, the daily average temperature was eight times below the average of the period from 1981 to 2010 (20.2 °C). The maximum temperature was only five days below 25 °C, ten days above 25 to 30 °C, and sixteen days above 30 °C. The lowest temperature in August was 10.8 °C, and the highest temperature was 33.9 °C. In the first eight months, the average temperature was 0.85 °C higher than the long-term average. In the last month, the average temperature increased by 0.16 ° C in relation to the long-term average.
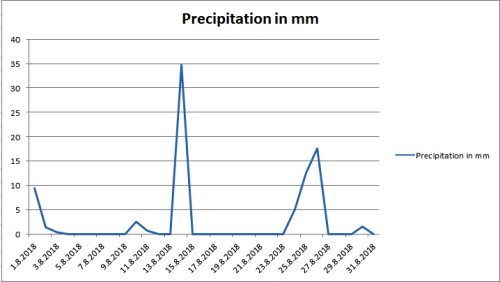
Precipitation data show that there was less precipitation in August. In August, only 77 % of the precipitation dropped, as is the long-standing average. The measuring device detected 86.4 mm of precipitation, which is much less as long as the long-term average (112 mm of precipitation). In the first eight months, 29.4 mm more precipitation fell than the long-term average. In the first eight months we recorded as much as 115 precipitation days, almost half of all days (47.3 %).
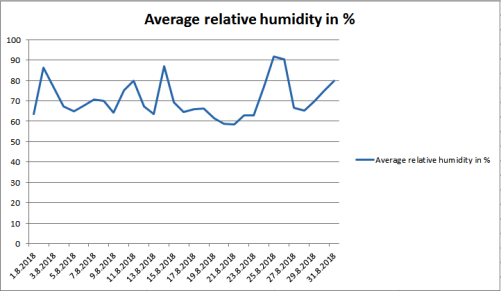
The average relative humidity in August was 70.62 %, which is similar to the months of May, June and July. According to cold night, this was expected. Therefore, relative humidity, despite high daily temperatures, only once dropped below 60 %. As a result, molds and rust appeared in the orchard and vegetable fields (tomatoes, potatoes).
The difference between the highest (August 9) and the lowest (August 27) measured temperature in the month was as high as 23.1 °C. This is not a big surprise for August, as it is characteristic that in the second half of the month, night temperatures are significantly reduced.
The average monthly temperature was also significantly higher than the average of the period from 1981 to 2010 – it was 22.16 °C, and it was 1.96 °C higher than the long-term average. The long-term average for August is 20.2 °C in Maribor. The average temperature fluctuated slightly in the first three weeks, but did not change excessively. In the last week, the average temperature dropped by as much as 5 to 6 °C. The difference between the average temperature of the coldest (August 26) and the warmest (August 9) day was 13.7 °C. There were also great differences between night and day temperatures, up to 18 °C, which is more than in May, June and July.
In August, the daily average temperature was eight times below the average of the period from 1981 to 2010 (20.2 °C). The maximum temperature was only five days below 25 °C, ten days above 25 to 30 °C, and sixteen days above 30 °C. The lowest temperature in August was 10.8 °C, and the highest temperature was 33.9 °C. In the first eight months, the average temperature was 0.85 °C higher than the long-term average. In the last month, the average temperature increased by 0.16 ° C in relation to the long-term average.
Precipitation data show that there was less precipitation in August. In August, only 77 % of the precipitation dropped, as is the long-standing average. The measuring device detected 86.4 mm of precipitation, which is much less as long as the long-term average (112 mm of precipitation). In the first eight months, 29.4 mm more precipitation fell than the long-term average. In the first eight months we recorded as much as 115 precipitation days, almost half of all days (47.3 %).
The average relative humidity in August was 70.62 %, which is similar to the months of May, June and July. According to cold night, this was expected. Therefore, relative humidity, despite high daily temperatures, only once dropped below 60 %. As a result, molds and rust appeared in the orchard and vegetable fields (tomatoes, potatoes).
... link (0 Kommentare) ... comment
Freitag, 3. August 2018
Meteorological report for July (Maribor)
beekids, 23:29h
In July there was a similar weather as in June. The weather changed day by day. Compared to previous years, this July was completely untypical. The first part of the month was colder, with more precipitation, and the second part of the month was much warmer and with less precipitation.
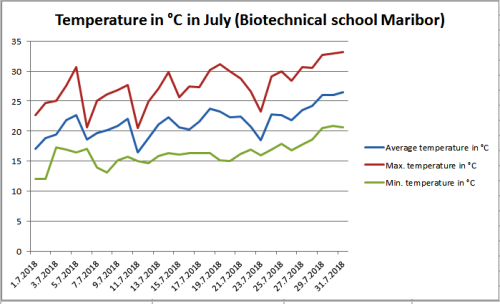
The difference between the highest (31st July) and the lowest (1st and 2nd July) measured temperature in the month was as high as 21.1 °C.
The average monthly temperature was also significantly higher than the average of the period from 1981 to 2010 – it was 21.54 °C, and it was 0.54 °C higher than the long-term average. The long-term average for July is 21.0 °C in Maribor. The average temperature fluctuated weekly (for 5 to 6 days, it was growing and then dropped again). The difference between the average temperature of the coldest (July 11) and the warmest (July 31) day was 10.05 °C. There were also great differences between night and day temperatures, up to 16 °C, which is similar to that in May and June.
In July, the daily average temperature was thirteen times below the average of the period from 1981 to 2010 (21.0 °C). The maximum temperature was only six days below 25 °C, sixteen days above 25 °C, and nine days above 30 °C. The lowest temperature in July was 12.1 °C, and the highest temperature was 33.2 °C. In the first seven months, the average temperature was 0.69 °C higher than the long-term average.
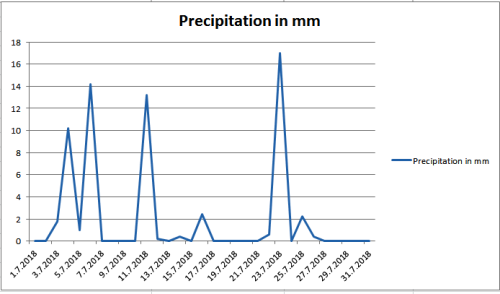
Precipitation data show that there was less precipitation in July. In July, only two-thirds of the precipitation dropped, as is the long-standing average. The measuring device detected 63.6 mm of precipitation, which is much less as long as the long-term average (94 mm of precipitation). In the first seven months, 55 mm more precipitation fell than the long-term average. In the first seven months we recorded as much as 105 precipitation days, almost half of all days (49.53 %).
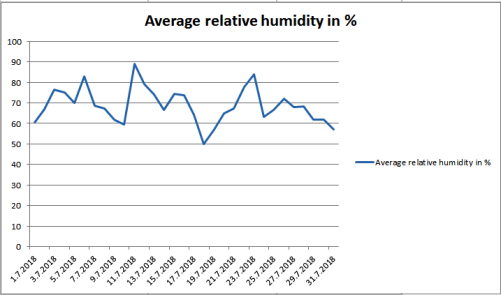
The average relative humidity in July was 68.72 %, which is similar to the months of May and June. Given the many precipitation days, this was expected.
The difference between the highest (31st July) and the lowest (1st and 2nd July) measured temperature in the month was as high as 21.1 °C.
The average monthly temperature was also significantly higher than the average of the period from 1981 to 2010 – it was 21.54 °C, and it was 0.54 °C higher than the long-term average. The long-term average for July is 21.0 °C in Maribor. The average temperature fluctuated weekly (for 5 to 6 days, it was growing and then dropped again). The difference between the average temperature of the coldest (July 11) and the warmest (July 31) day was 10.05 °C. There were also great differences between night and day temperatures, up to 16 °C, which is similar to that in May and June.
In July, the daily average temperature was thirteen times below the average of the period from 1981 to 2010 (21.0 °C). The maximum temperature was only six days below 25 °C, sixteen days above 25 °C, and nine days above 30 °C. The lowest temperature in July was 12.1 °C, and the highest temperature was 33.2 °C. In the first seven months, the average temperature was 0.69 °C higher than the long-term average.
Precipitation data show that there was less precipitation in July. In July, only two-thirds of the precipitation dropped, as is the long-standing average. The measuring device detected 63.6 mm of precipitation, which is much less as long as the long-term average (94 mm of precipitation). In the first seven months, 55 mm more precipitation fell than the long-term average. In the first seven months we recorded as much as 105 precipitation days, almost half of all days (49.53 %).
The average relative humidity in July was 68.72 %, which is similar to the months of May and June. Given the many precipitation days, this was expected.
... link (0 Kommentare) ... comment
Dienstag, 3. Juli 2018
Meteorological report for June (Maribor)
beekids, 01:10h
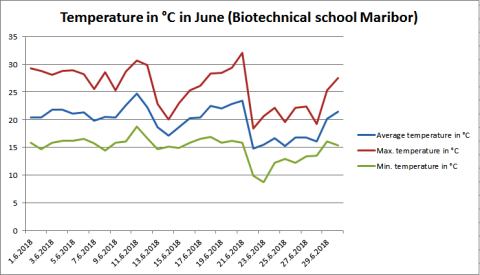
You could say nothing new. Unpredictable weather continued in June. The weather changed day by day. Compared to previous years, this June was completely untypical. Temperatures fluctuated throughout the month, and rainfall was more frequent, but it was not abundant.
The difference between the highest (21st June) and the lowest (23th June) measured temperature in the month was as high as 23.2 °C.
The average monthly temperature was also significantly higher than the average of the period from 1981 to 2010 – it was 19.87 °C, and it was 0.87 °C higher than the long-term average. The long-term average for June is 19.0 °C in Maribor. The average temperature varied throughout the month. The difference between the average temperature of the coldest (June 22) and the warmest (June 11) day was 9.85 °C. There were also great differences between night and day temperatures, up to 16 °C, which is similar to that in May.
In June, the daily average temperature was ten times below the average of the period from 1981 to 2010 (19.0 °C). The maximum temperature was twenty-seven times above 20 °C, thereof twenty days above 25 °C, and for two days even above 30 °C. The lowest temperature in June was 8.8 °C, and the highest temperature was 32.0 °C. In the first six months, the average temperature was 0.72 °C higher than the long-term average.
Precipitation data show that there was much less precipitation in June than in May. In June, half of the precipitation dropped, as the long-term average. The measuring device detected 50.6 mm of precipitation, which is much less as long as the long-term average (107 mm of precipitation). In the first six months, 85.4 mm more precipitation fell than the long-term average.
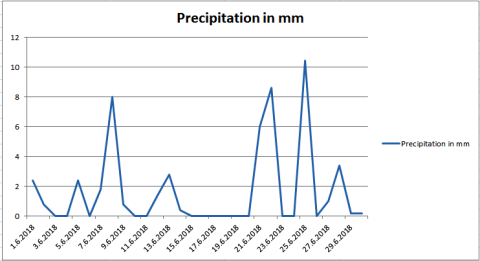
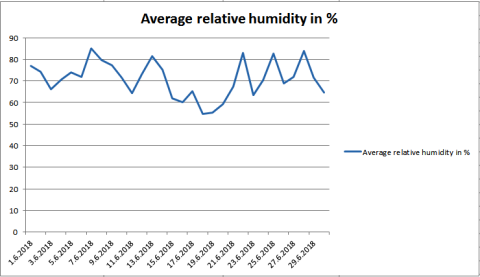
The average relative humidity in June was 70.86 %, which is similar to the month of May. Given the frequent precipitation, this was expected.
The difference between the highest (21st June) and the lowest (23th June) measured temperature in the month was as high as 23.2 °C.
The average monthly temperature was also significantly higher than the average of the period from 1981 to 2010 – it was 19.87 °C, and it was 0.87 °C higher than the long-term average. The long-term average for June is 19.0 °C in Maribor. The average temperature varied throughout the month. The difference between the average temperature of the coldest (June 22) and the warmest (June 11) day was 9.85 °C. There were also great differences between night and day temperatures, up to 16 °C, which is similar to that in May.
In June, the daily average temperature was ten times below the average of the period from 1981 to 2010 (19.0 °C). The maximum temperature was twenty-seven times above 20 °C, thereof twenty days above 25 °C, and for two days even above 30 °C. The lowest temperature in June was 8.8 °C, and the highest temperature was 32.0 °C. In the first six months, the average temperature was 0.72 °C higher than the long-term average.
Precipitation data show that there was much less precipitation in June than in May. In June, half of the precipitation dropped, as the long-term average. The measuring device detected 50.6 mm of precipitation, which is much less as long as the long-term average (107 mm of precipitation). In the first six months, 85.4 mm more precipitation fell than the long-term average.
The average relative humidity in June was 70.86 %, which is similar to the month of May. Given the frequent precipitation, this was expected.
... link (0 Kommentare) ... comment
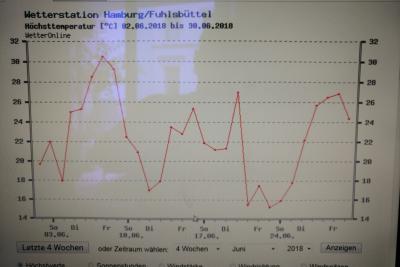
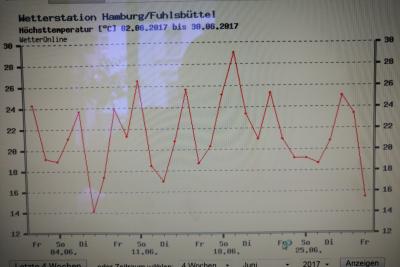
High temperature in Hamburg in June 2018
meadowkids.eu, 16:59h
If we look at the hail we see that the June this year was very dry.
A little different show us the high temperatures in June. The last two years are really warm. Last year had only a small amount of different (~0,4 degree) to this year. This is important because the very wet year had lower temperatures in case of the wetness. but still around 21 degrees mean.
https://www.wetteronline.de/wetterdaten/hamburg?pcid=pc_rueckblick_data&gid=10147&pid=p_rueckblick_diagram&sid=StationHistory&iid=10147&metparaid=TXLD&period=4&month=05&year=2018
Also the highest and lowest temperature are nearly the same (around 30 and around 14 degree). But the June in 2018 is a little higher.
https://www.wetteronline.de/wetterdaten/hamburg?pcid=pc_rueckblick_data&gid=10147&pid=p_rueckblick_diagram&sid=StationHistory&iid=10147&metparaid=TXLD&period=4&month=05&year=2017
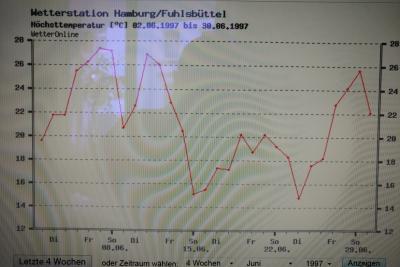
In the last 3 decades are not much different between the highest temperatures.
https://www.wetteronline.de/wetterdaten/hamburg?pcid=pc_rueckblick_data&gid=10147&pid=p_rueckblick_diagram&sid=StationHistory&iid=10147&metparaid=TXLD&period=4&month=05&year=1997
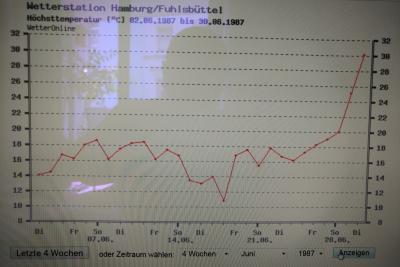
The lowest temperature had more differents and growed between 1987 and 2018 nearby 3 degree. On average the temperature grow up nerby 5 degree in month.
https://www.wetteronline.de/wetterdaten/hamburg?pcid=pc_rueckblick_data&gid=10147&pid=p_rueckblick_diagram&sid=StationHistory&iid=10147&month=05&year=1987&period=4&metparaid=TXLD
Despite all the fluctuations and differences of the individual years or decades, the trend is continuing that Hamburg is becoming warmer and drier.
The fluctuations within a month or several years are becoming more and more variable and the individual phenomena such as rain and heat more unpredictable.
A little different show us the high temperatures in June. The last two years are really warm. Last year had only a small amount of different (~0,4 degree) to this year. This is important because the very wet year had lower temperatures in case of the wetness. but still around 21 degrees mean.
https://www.wetteronline.de/wetterdaten/hamburg?pcid=pc_rueckblick_data&gid=10147&pid=p_rueckblick_diagram&sid=StationHistory&iid=10147&metparaid=TXLD&period=4&month=05&year=2018
Also the highest and lowest temperature are nearly the same (around 30 and around 14 degree). But the June in 2018 is a little higher.
https://www.wetteronline.de/wetterdaten/hamburg?pcid=pc_rueckblick_data&gid=10147&pid=p_rueckblick_diagram&sid=StationHistory&iid=10147&metparaid=TXLD&period=4&month=05&year=2017
In the last 3 decades are not much different between the highest temperatures.
https://www.wetteronline.de/wetterdaten/hamburg?pcid=pc_rueckblick_data&gid=10147&pid=p_rueckblick_diagram&sid=StationHistory&iid=10147&metparaid=TXLD&period=4&month=05&year=1997
The lowest temperature had more differents and growed between 1987 and 2018 nearby 3 degree. On average the temperature grow up nerby 5 degree in month.
https://www.wetteronline.de/wetterdaten/hamburg?pcid=pc_rueckblick_data&gid=10147&pid=p_rueckblick_diagram&sid=StationHistory&iid=10147&month=05&year=1987&period=4&metparaid=TXLD
Despite all the fluctuations and differences of the individual years or decades, the trend is continuing that Hamburg is becoming warmer and drier.
The fluctuations within a month or several years are becoming more and more variable and the individual phenomena such as rain and heat more unpredictable.
... link (0 Kommentare) ... comment
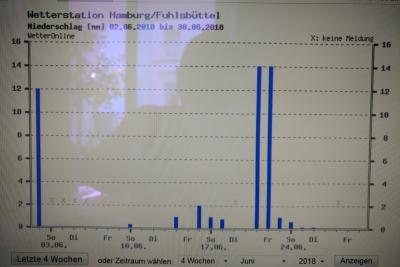
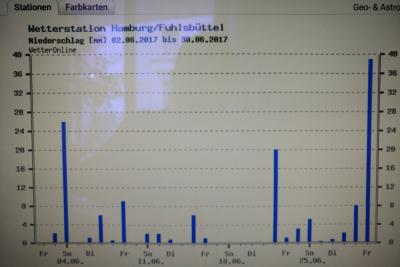
June weather Hamburg hail in 2018
meadowkids.eu, 16:02h
After a lot of month we can see in the last former month the clima change going on.
We saw it in Maribor and also in Hamburg.
At first we take a look to our hail, like rain.
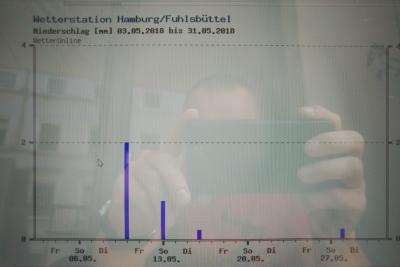
Our former month Juni was the driest in the last thirthy years!
We had only 12 days with rain and only round about 46,7 mm per squaremeters and month.
https://www.wetteronline.de/wetterdaten/hamburg?pcid=pc_rueckblick_data&gid=10147&pid=p_rueckblick_diagram&sid=StationHistory&iid=10147&metparaid=RR24&period=4&month=05&year=2018
The comparison to the same month last year, we know all, it was in Hamburg a really wet year we had by 20 days 142 mm hail per month.
https://www.wetteronline.de/wetterdaten/hamburg?pcid=pc_rueckblick_data&gid=10147&pid=p_rueckblick_diagram&sid=StationHistory&iid=10147&metparaid=RR24&period=4&month=05&year=2017
Between this kind of extreme datas are the "normal" datas around 90 mm over the last decades per month. Also the count of hail days lying around 20 days. 2018 layed below and 2017 far greatly enhanced.
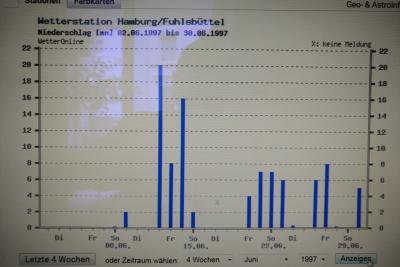
https://www.wetteronline.de/wetterdaten/hamburg?pcid=pc_rueckblick_data&gid=10147&pid=p_rueckblick_diagram&sid=StationHistory&iid=10147&month=05&year=1997&period=4&metparaid=RR24
The Maxium hail by day lied in the last decades around 20mm per squaremeter.
Last year we had enhanced rainfall by 39mm and this year only 14 mm per month.
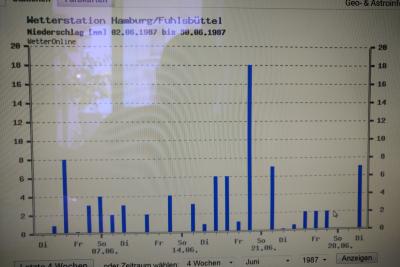
https://www.wetteronline.de/wetterdaten/hamburg?pcid=pc_rueckblick_data&gid=10147&pid=p_rueckblick_diagram&sid=StationHistory&iid=10147&metparaid=RR24&period=4&month=05&year=1987
The lowest figure of rainfall remaind exceot last year around 0,1 /0,2mm per squaremeters.
We saw it in Maribor and also in Hamburg.
At first we take a look to our hail, like rain.
Our former month Juni was the driest in the last thirthy years!
We had only 12 days with rain and only round about 46,7 mm per squaremeters and month.
https://www.wetteronline.de/wetterdaten/hamburg?pcid=pc_rueckblick_data&gid=10147&pid=p_rueckblick_diagram&sid=StationHistory&iid=10147&metparaid=RR24&period=4&month=05&year=2018
The comparison to the same month last year, we know all, it was in Hamburg a really wet year we had by 20 days 142 mm hail per month.
https://www.wetteronline.de/wetterdaten/hamburg?pcid=pc_rueckblick_data&gid=10147&pid=p_rueckblick_diagram&sid=StationHistory&iid=10147&metparaid=RR24&period=4&month=05&year=2017
Between this kind of extreme datas are the "normal" datas around 90 mm over the last decades per month. Also the count of hail days lying around 20 days. 2018 layed below and 2017 far greatly enhanced.
https://www.wetteronline.de/wetterdaten/hamburg?pcid=pc_rueckblick_data&gid=10147&pid=p_rueckblick_diagram&sid=StationHistory&iid=10147&month=05&year=1997&period=4&metparaid=RR24
The Maxium hail by day lied in the last decades around 20mm per squaremeter.
Last year we had enhanced rainfall by 39mm and this year only 14 mm per month.
https://www.wetteronline.de/wetterdaten/hamburg?pcid=pc_rueckblick_data&gid=10147&pid=p_rueckblick_diagram&sid=StationHistory&iid=10147&metparaid=RR24&period=4&month=05&year=1987
The lowest figure of rainfall remaind exceot last year around 0,1 /0,2mm per squaremeters.
... link (0 Kommentare) ... comment
Donnerstag, 28. Juni 2018
Meteorological report for May (Maribor)
beekids, 00:24h
The weather in May was more like the weather, which is typical for the month of April. At least according to the large amount of precipitation. But the temperatures were even more typical for May. The difference between the highest (28th May) and the lowest (16th May) measured temperature in the month was as high as 20.5 °C.
The average monthly temperature was also significantly higher than the average of the period from 1981 to 2010 – it was 17.67 °C, and it was 1.87 °C higher than the long-term average. The long-term average for May is 15.8 °C in Maribor. The average temperature was quite constant throughout the month. However, there were great differences between night and day temperatures, even up to 15 °C, which is more typical for August.
In May, the daily average temperature was only six times below the average of the period from 1981 to 2010 (15.8 °C). The maximum temperature was twenty-nine times above 20 °C, thereof twelve days above 25 °C. The lowest temperature in May was 8.1 °C, and the highest temperature was 28.6 °C. In the first five months, the average temperature was 0.68 °C higher than the long-term average.
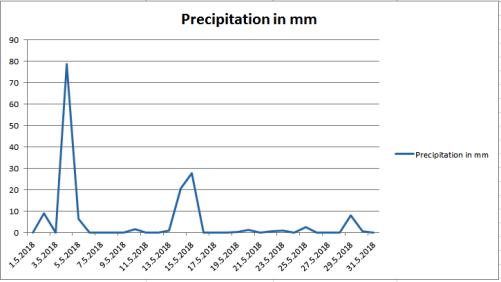
Precipitation during May was very rich with rain. In May, there were twice as much rainfall as the long-term average. The measuring device detected 160.4 mm of precipitation, which is much more as long as the long-term average (83 mm of precipitation). In the first five months, was 141.8 mm more precipitation than the long-term average.
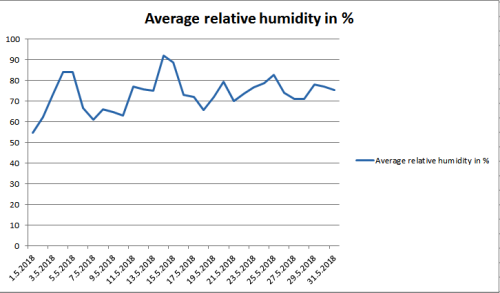
The average relative humidity in April was 73.38 %, which is 11.16 % much more as in April. This was expected due to much more precipitation.
The average monthly temperature was also significantly higher than the average of the period from 1981 to 2010 – it was 17.67 °C, and it was 1.87 °C higher than the long-term average. The long-term average for May is 15.8 °C in Maribor. The average temperature was quite constant throughout the month. However, there were great differences between night and day temperatures, even up to 15 °C, which is more typical for August.
In May, the daily average temperature was only six times below the average of the period from 1981 to 2010 (15.8 °C). The maximum temperature was twenty-nine times above 20 °C, thereof twelve days above 25 °C. The lowest temperature in May was 8.1 °C, and the highest temperature was 28.6 °C. In the first five months, the average temperature was 0.68 °C higher than the long-term average.
Precipitation during May was very rich with rain. In May, there were twice as much rainfall as the long-term average. The measuring device detected 160.4 mm of precipitation, which is much more as long as the long-term average (83 mm of precipitation). In the first five months, was 141.8 mm more precipitation than the long-term average.
The average relative humidity in April was 73.38 %, which is 11.16 % much more as in April. This was expected due to much more precipitation.
... link (0 Kommentare) ... comment
Dienstag, 5. Juni 2018
Weatherdata May 2018 Hamburg
meadowkids.eu, 17:34h
Now the new weather report from Hamburg about may 2018.
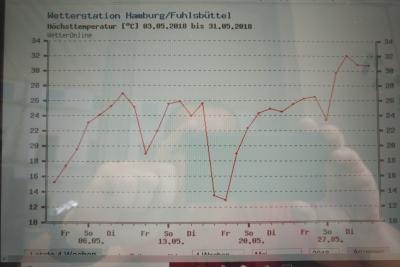
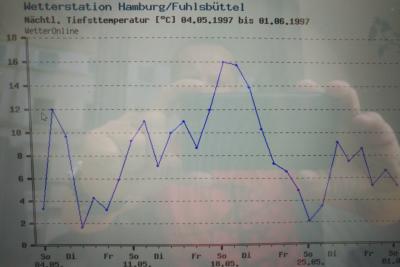
the highest temperature in this may was 32 degree. In the last yeears e.g. last 20 years was the highest temperature 27 degrees. That are different about 5 degrees. It`s one more example of the extremly differents weatherphenoms in pasted years.
https://www.wetteronline.de/wetterdaten/hamburg?pcid=pc_rueckblick_data&gid=10147&pid=p_rueckblick_diagram&sid=StationHistory&iid=10147&month=05&year=1997&period=4&metparaid=TXLD
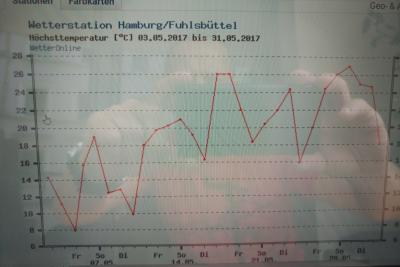
https://www.wetteronline.de/wetterdaten/hamburg?pcid=pc_rueckblick_data&gid=10147&pid=p_rueckblick_diagram&sid=StationHistory&iid=10147&metparaid=TXLD&period=4&month=05&year=2017
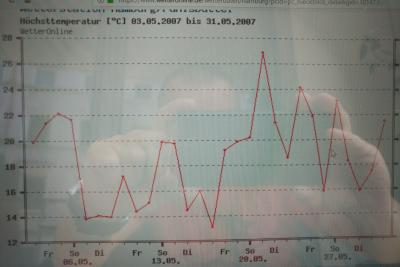
https://www.wetteronline.de/wetterdaten/hamburg?pcid=pc_rueckblick_data&gid=10147&pid=p_rueckblick_diagram&sid=StationHistory&iid=10147&metparaid=TXLD&period=4&month=05&year=2007
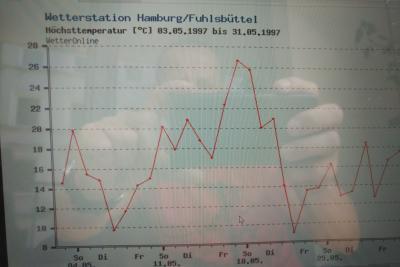
https://www.wetteronline.de/wetterdaten/hamburg?pcid=pc_rueckblick_data&gid=10147&pid=p_rueckblick_diagram&sid=StationHistory&iid=10147&metparaid=TXLD&period=4&month=05&year=1997
We can see how different the middle of data scale lies before 10 years near by 20 degrees. I the passt 10 years it was climbing average nearly two degree, so was the middle by 22 degree and than by 24 degree in the past years.
The coldest tempeartures 20 years ago around four degrees. Last year, a very weet year, we had at the beginning of the month temperature by and under zero degree. The other years only trough the months around 4 degree.
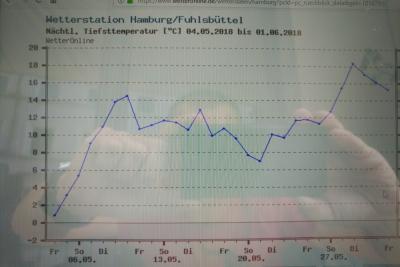
https://www.wetteronline.de/wetterdaten/hamburg?pcid=pc_rueckblick_data&gid=10147&pid=p_rueckblick_diagram&sid=StationHistory&iid=10147&metparaid=TNLD&period=4&month=05&year=2018

https://www.wetteronline.de/wetterdaten/hamburg?pcid=pc_rueckblick_data&gid=10147&pid=p_rueckblick_diagram&sid=StationHistory&iid=10147&metparaid=TNLD&period=4&month=05&year=2017
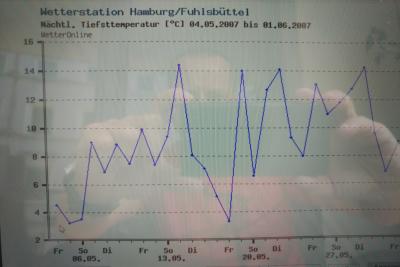
https://www.wetteronline.de/wetterdaten/hamburg?pcid=pc_rueckblick_data&gid=10147&pid=p_rueckblick_diagram&sid=StationHistory&iid=10147&metparaid=TNLD&period=4&month=05&year=2007
https://www.wetteronline.de/wetterdaten/hamburg?pcid=pc_rueckblick_data&gid=10147&pid=p_rueckblick_diagram&sid=StationHistory&iid=10147&metparaid=TNLD&period=4&month=05&year=1997
The middle of temperatures was around 8 degrees but the often under that line. Only in 2017 it was colder. But the tendency going up.
The hail was also a phenomenon. This may in 2018 wass very dry. We had only four days with high grad of rain.
https://www.wetteronline.de/wetterdaten/hamburg?pcid=pc_rueckblick_data&gid=10147&pid=p_rueckblick_diagram&sid=StationHistory&iid=10147&month=05&year=2018&period=4&metparaid=RR24

https://www.wetteronline.de/wetterdaten/hamburg?pcid=pc_rueckblick_data&gid=10147&pid=p_rueckblick_diagram&sid=StationHistory&iid=10147&metparaid=RR24&period=4&month=05&year=2017
In this year 2017 we had 13 days with hail. But it had not so high grad like this year 2018.
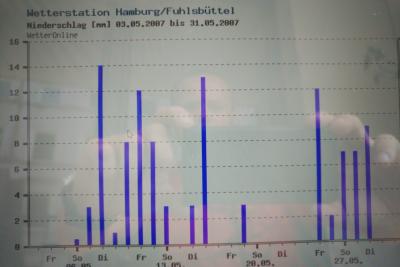
https://www.wetteronline.de/wetterdaten/hamburg?pcid=pc_rueckblick_data&gid=10147&pid=p_rueckblick_diagram&sid=StationHistory&iid=10147&metparaid=RR24&period=4&month=05&year=2007
In the year 2007 we had 16 days of hail.
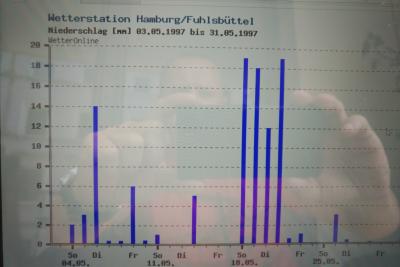
https://www.wetteronline.de/wetterdaten/hamburg?pcid=pc_rueckblick_data&gid=10147&pid=p_rueckblick_diagram&sid=StationHistory&iid=10147&metparaid=RR24&period=4&month=05&year=1997
In 1997 and the years up to 2016 had more days with hail. Last year the hail lying in highest numbers around 14 Millimeter per squaremeters. Last year was one day with 32 mm. But the other days lying between 1 and 9 Millimeters. This year at the fiew days of hail there was only a maximum of 2 Millimeter per squaremeter.
We have a tendency to more dry years.
Lasst year we can`t planted our pumkinschoots before June because the nights had temperatures by night under 10 degrees. This year it was possible to planted in May. We where only late because of the examinations of our students.
the highest temperature in this may was 32 degree. In the last yeears e.g. last 20 years was the highest temperature 27 degrees. That are different about 5 degrees. It`s one more example of the extremly differents weatherphenoms in pasted years.
https://www.wetteronline.de/wetterdaten/hamburg?pcid=pc_rueckblick_data&gid=10147&pid=p_rueckblick_diagram&sid=StationHistory&iid=10147&month=05&year=1997&period=4&metparaid=TXLD
https://www.wetteronline.de/wetterdaten/hamburg?pcid=pc_rueckblick_data&gid=10147&pid=p_rueckblick_diagram&sid=StationHistory&iid=10147&metparaid=TXLD&period=4&month=05&year=2017
https://www.wetteronline.de/wetterdaten/hamburg?pcid=pc_rueckblick_data&gid=10147&pid=p_rueckblick_diagram&sid=StationHistory&iid=10147&metparaid=TXLD&period=4&month=05&year=2007
https://www.wetteronline.de/wetterdaten/hamburg?pcid=pc_rueckblick_data&gid=10147&pid=p_rueckblick_diagram&sid=StationHistory&iid=10147&metparaid=TXLD&period=4&month=05&year=1997
We can see how different the middle of data scale lies before 10 years near by 20 degrees. I the passt 10 years it was climbing average nearly two degree, so was the middle by 22 degree and than by 24 degree in the past years.
The coldest tempeartures 20 years ago around four degrees. Last year, a very weet year, we had at the beginning of the month temperature by and under zero degree. The other years only trough the months around 4 degree.
https://www.wetteronline.de/wetterdaten/hamburg?pcid=pc_rueckblick_data&gid=10147&pid=p_rueckblick_diagram&sid=StationHistory&iid=10147&metparaid=TNLD&period=4&month=05&year=2018
https://www.wetteronline.de/wetterdaten/hamburg?pcid=pc_rueckblick_data&gid=10147&pid=p_rueckblick_diagram&sid=StationHistory&iid=10147&metparaid=TNLD&period=4&month=05&year=2017
https://www.wetteronline.de/wetterdaten/hamburg?pcid=pc_rueckblick_data&gid=10147&pid=p_rueckblick_diagram&sid=StationHistory&iid=10147&metparaid=TNLD&period=4&month=05&year=2007
https://www.wetteronline.de/wetterdaten/hamburg?pcid=pc_rueckblick_data&gid=10147&pid=p_rueckblick_diagram&sid=StationHistory&iid=10147&metparaid=TNLD&period=4&month=05&year=1997
The middle of temperatures was around 8 degrees but the often under that line. Only in 2017 it was colder. But the tendency going up.
The hail was also a phenomenon. This may in 2018 wass very dry. We had only four days with high grad of rain.
https://www.wetteronline.de/wetterdaten/hamburg?pcid=pc_rueckblick_data&gid=10147&pid=p_rueckblick_diagram&sid=StationHistory&iid=10147&month=05&year=2018&period=4&metparaid=RR24
https://www.wetteronline.de/wetterdaten/hamburg?pcid=pc_rueckblick_data&gid=10147&pid=p_rueckblick_diagram&sid=StationHistory&iid=10147&metparaid=RR24&period=4&month=05&year=2017
In this year 2017 we had 13 days with hail. But it had not so high grad like this year 2018.
https://www.wetteronline.de/wetterdaten/hamburg?pcid=pc_rueckblick_data&gid=10147&pid=p_rueckblick_diagram&sid=StationHistory&iid=10147&metparaid=RR24&period=4&month=05&year=2007
In the year 2007 we had 16 days of hail.
https://www.wetteronline.de/wetterdaten/hamburg?pcid=pc_rueckblick_data&gid=10147&pid=p_rueckblick_diagram&sid=StationHistory&iid=10147&metparaid=RR24&period=4&month=05&year=1997
In 1997 and the years up to 2016 had more days with hail. Last year the hail lying in highest numbers around 14 Millimeter per squaremeters. Last year was one day with 32 mm. But the other days lying between 1 and 9 Millimeters. This year at the fiew days of hail there was only a maximum of 2 Millimeter per squaremeter.
We have a tendency to more dry years.
Lasst year we can`t planted our pumkinschoots before June because the nights had temperatures by night under 10 degrees. This year it was possible to planted in May. We where only late because of the examinations of our students.
... link (0 Kommentare) ... comment
Dienstag, 22. Mai 2018
Weatherreport April 2018 Hamburg
meadowkids.eu, 17:02h
The april is a month where the weather is going up and down. We had some days with heavy rainfall and some days with highest temperatures up to 27 degree. By the 20.4. we had the highest temperature and it following down by night to 15 degrees. This switching make it unpossible to plant out the pumpkin spoots.
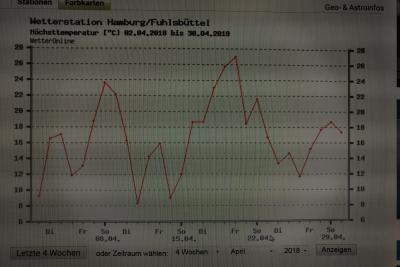
highest temperatures April 2018
https://www.wetteronline.de/wetterdaten/hamburg?pcid=pc_rueckblick_data&gid=10147&pid=p_rueckblick_diagram&sid=StationHistory&iid=10147&metparaid=TXLD&period=4&month=04&year=2018
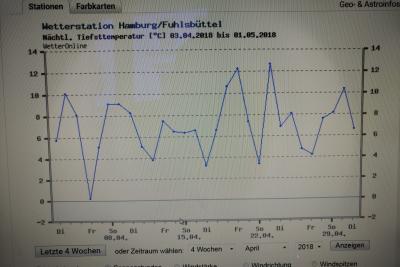
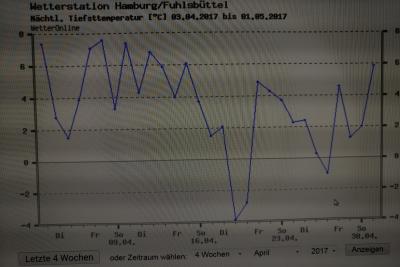
the lowest temperatures 2018
https://www.wetteronline.de/wetterdaten/hamburg?pcid=pc_rueckblick_data&gid=10147&pid=p_rueckblick_diagram&sid=StationHistory&iid=10147&month=04&year=2018&period=4&metparaid=TNLD
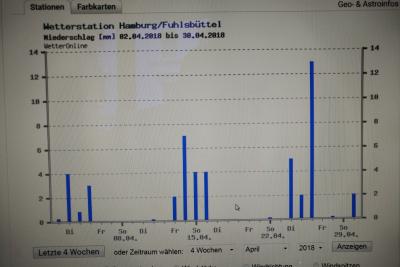
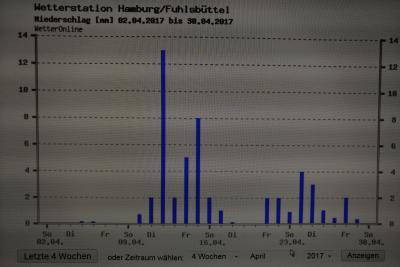
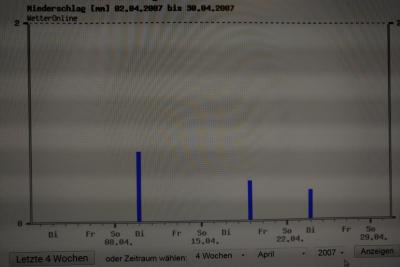
hail in April 2018
https://www.wetteronline.de/wetterdaten/hamburg?pcid=pc_rueckblick_data&gid=10147&pid=p_rueckblick_diagram&sid=StationHistory&iid=10147&month=04&year=2018&period=4&metparaid=RR24
If we take a look at the haildays we see, that last year was very wet with maximum days 20 with hail. Also this days had a large amount of water. This year and last year had days with 13 mm Rainfall. The last decades had maxium by 10 mm per day.
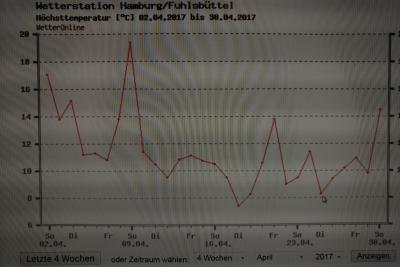
highest temperatures in 2017
https://www.wetteronline.de/wetterdaten/hamburg?pcid=pc_rueckblick_data&gid=10147&pid=p_rueckblick_diagram&sid=StationHistory&iid=10147&metparaid=TXLD&period=4&month=04&year=2017
If we look at the highest temperature trough the last decades we can see that the temperature rise from year to year. The highest temperature this year in april was 27 degree. In 2017 only 19 but it wa sa rany month. In 2007 we had 18 degree as hih as possible. In 1997 we had only 16 degree as the highest temperature.
lowest temperature 2017
https://www.wetteronline.de/wetterdaten/hamburg?pcid=pc_rueckblick_data&gid=10147&pid=p_rueckblick_diagram&sid=StationHistory&iid=10147&month=04&year=2017&period=4&metparaid=TNLD
The lowest night temperatures are waving between -,2 and zero degrees in the decades. the same effect we can see by the highest temperature in the wave of lowest temperatures. They wave over the decades between 7,9 degree and 12 degree.In small step get the count of peaks in the waves up. from 7 in 1997 to 10 and 9 in 2017/18. The peaks by the highest temperature gone more less. Whereas in 1997 10 days with rising temperatures are in 2017/18 less like 9 and 8 peaks.
The current trend is, that the different between the lowest temperatures per days at month raised. If we get the highest low temperature in 2018 and the highest day temperature at the same year, we see 14,7 degree different. In 1996 that are only 5,8 degree.
hail April 2017
https://www.wetteronline.de/wetterdaten/hamburg?pcid=pc_rueckblick_data&gid=10147&pid=p_rueckblick_diagram&sid=StationHistory&iid=10147&month=04&year=2017&period=4&metparaid=RR24
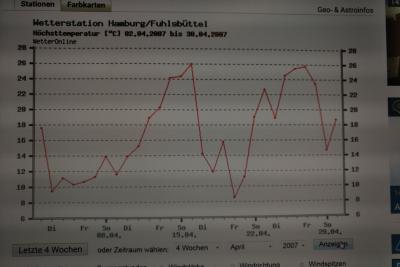
highest temperatures April 2007
https://www.wetteronline.de/wetterdaten/hamburg?pcid=pc_rueckblick_data&gid=10147&pid=p_rueckblick_diagram&sid=StationHistory&iid=10147&metparaid=TXLD&period=4&month=04&year=2007
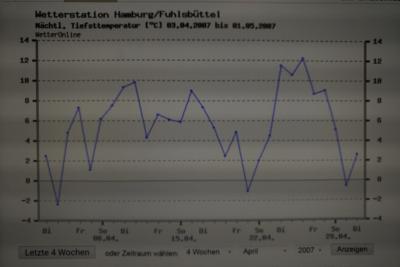
lowest temperatures April 2007
https://www.wetteronline.de/wetterdaten/hamburg?pcid=pc_rueckblick_data&gid=10147&pid=p_rueckblick_diagram&sid=StationHistory&iid=10147&month=04&year=2007&period=4&metparaid=TNLD
hail April 2007
https://www.wetteronline.de/wetterdaten/hamburg?pcid=pc_rueckblick_data&gid=10147&pid=p_rueckblick_diagram&sid=StationHistory&iid=10147&month=04&year=2007&period=4&metparaid=RR24
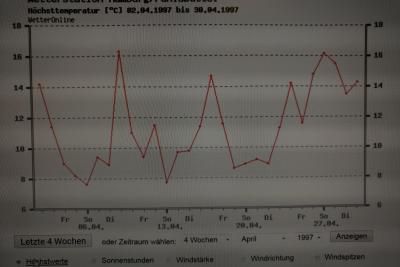
highest temperatures April 1997
https://www.wetteronline.de/wetterdaten/hamburg?pcid=pc_rueckblick_data&gid=10147&pid=p_rueckblick_diagram&sid=StationHistory&iid=10147&month=04&year=1997&period=4&metparaid=TXLD
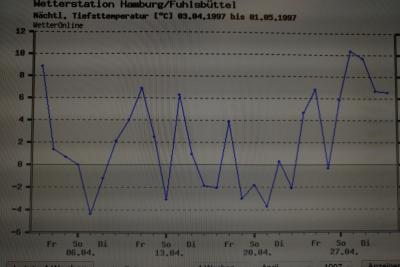
lowest temperatures April 1997
https://www.wetteronline.de/wetterdaten/hamburg?pcid=pc_rueckblick_data&gid=10147&pid=p_rueckblick_diagram&sid=StationHistory&iid=10147&month=04&year=1997&period=4&metparaid=TNLD
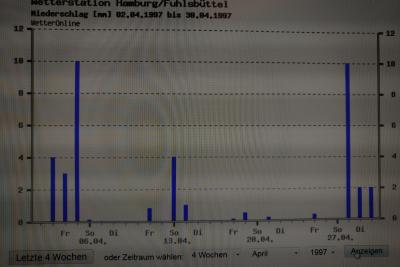
hail April 1997
https://www.wetteronline.de/wetterdaten/hamburg?pcid=pc_rueckblick_data&gid=10147&pid=p_rueckblick_diagram&sid=StationHistory&iid=10147&metparaid=RR24&period=4&month=04&year=1997
highest temperatures April 2018
https://www.wetteronline.de/wetterdaten/hamburg?pcid=pc_rueckblick_data&gid=10147&pid=p_rueckblick_diagram&sid=StationHistory&iid=10147&metparaid=TXLD&period=4&month=04&year=2018
the lowest temperatures 2018
https://www.wetteronline.de/wetterdaten/hamburg?pcid=pc_rueckblick_data&gid=10147&pid=p_rueckblick_diagram&sid=StationHistory&iid=10147&month=04&year=2018&period=4&metparaid=TNLD
hail in April 2018
https://www.wetteronline.de/wetterdaten/hamburg?pcid=pc_rueckblick_data&gid=10147&pid=p_rueckblick_diagram&sid=StationHistory&iid=10147&month=04&year=2018&period=4&metparaid=RR24
If we take a look at the haildays we see, that last year was very wet with maximum days 20 with hail. Also this days had a large amount of water. This year and last year had days with 13 mm Rainfall. The last decades had maxium by 10 mm per day.
highest temperatures in 2017
https://www.wetteronline.de/wetterdaten/hamburg?pcid=pc_rueckblick_data&gid=10147&pid=p_rueckblick_diagram&sid=StationHistory&iid=10147&metparaid=TXLD&period=4&month=04&year=2017
If we look at the highest temperature trough the last decades we can see that the temperature rise from year to year. The highest temperature this year in april was 27 degree. In 2017 only 19 but it wa sa rany month. In 2007 we had 18 degree as hih as possible. In 1997 we had only 16 degree as the highest temperature.
lowest temperature 2017
https://www.wetteronline.de/wetterdaten/hamburg?pcid=pc_rueckblick_data&gid=10147&pid=p_rueckblick_diagram&sid=StationHistory&iid=10147&month=04&year=2017&period=4&metparaid=TNLD
The lowest night temperatures are waving between -,2 and zero degrees in the decades. the same effect we can see by the highest temperature in the wave of lowest temperatures. They wave over the decades between 7,9 degree and 12 degree.In small step get the count of peaks in the waves up. from 7 in 1997 to 10 and 9 in 2017/18. The peaks by the highest temperature gone more less. Whereas in 1997 10 days with rising temperatures are in 2017/18 less like 9 and 8 peaks.
The current trend is, that the different between the lowest temperatures per days at month raised. If we get the highest low temperature in 2018 and the highest day temperature at the same year, we see 14,7 degree different. In 1996 that are only 5,8 degree.
hail April 2017
https://www.wetteronline.de/wetterdaten/hamburg?pcid=pc_rueckblick_data&gid=10147&pid=p_rueckblick_diagram&sid=StationHistory&iid=10147&month=04&year=2017&period=4&metparaid=RR24
highest temperatures April 2007
https://www.wetteronline.de/wetterdaten/hamburg?pcid=pc_rueckblick_data&gid=10147&pid=p_rueckblick_diagram&sid=StationHistory&iid=10147&metparaid=TXLD&period=4&month=04&year=2007
lowest temperatures April 2007
https://www.wetteronline.de/wetterdaten/hamburg?pcid=pc_rueckblick_data&gid=10147&pid=p_rueckblick_diagram&sid=StationHistory&iid=10147&month=04&year=2007&period=4&metparaid=TNLD
hail April 2007
https://www.wetteronline.de/wetterdaten/hamburg?pcid=pc_rueckblick_data&gid=10147&pid=p_rueckblick_diagram&sid=StationHistory&iid=10147&month=04&year=2007&period=4&metparaid=RR24
highest temperatures April 1997
https://www.wetteronline.de/wetterdaten/hamburg?pcid=pc_rueckblick_data&gid=10147&pid=p_rueckblick_diagram&sid=StationHistory&iid=10147&month=04&year=1997&period=4&metparaid=TXLD
lowest temperatures April 1997
https://www.wetteronline.de/wetterdaten/hamburg?pcid=pc_rueckblick_data&gid=10147&pid=p_rueckblick_diagram&sid=StationHistory&iid=10147&month=04&year=1997&period=4&metparaid=TNLD
hail April 1997
https://www.wetteronline.de/wetterdaten/hamburg?pcid=pc_rueckblick_data&gid=10147&pid=p_rueckblick_diagram&sid=StationHistory&iid=10147&metparaid=RR24&period=4&month=04&year=1997
... link (0 Kommentare) ... comment
... nächste Seite