Sonntag, 25. Februar 2018
Weather data from the past 20 years in the November and the December
meadowkids.eu, 17:09h
In the last year we had a lot of peaks of rainfall. On the 3rd of June we had 77,1 l water on a square meter. December 2017 in Hamburg had only 4 days without rain and in January 2018 we had also only 7 days degrees below 0.
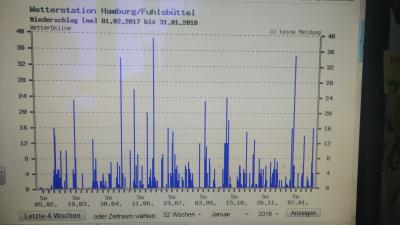
https://www.wetteronline.de/wetterdaten/hamburg?pcid=pc_rueckblick_data&gid=10147&pid=p_rueckblick_diagram&sid=StationHistory&iid=10147&month=01&year=2018&period=52&metparaid=RR24
The rainfall in this year was very unusual - the temperatures were higher for the December, also comparing with the last year. It`s warmer.
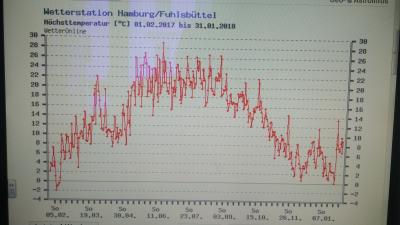
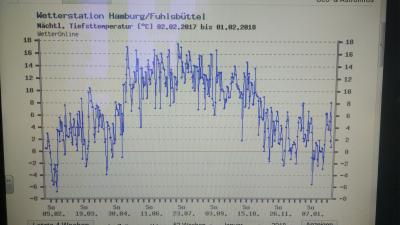
https://www.wetteronline.de/wetterdaten/hamburg?pcid=pc_rueckblick_data&gid=10147&pid=p_rueckblick_diagram&sid=StationHistory&iid=10147&month=01&year=2018&period=52&metparaid=TXLD
The following graphics will show your the temperatures of the last twenty years for the window from 7th of November to the 1st of January. It`s shows the winter from 2017/18, `15/`16, `14/`15,`07/`08 and `97/`98. Two things you will see over the years: The temperature gets more different peaks between high and low temperature per day. The other one is, that the peaks in 1997/98 only have 11 days over 10 degrees and often bellow 0 degree. In 2008 the most of the peaks have over 0 degree and only 16 day bellow. The difference between the highest and the lowest peaks per day are often far apart.
The last days in year 2018 we had a lot of rainy days, that lower the degrees, but we had rarely temperatures bellow 0 degree.
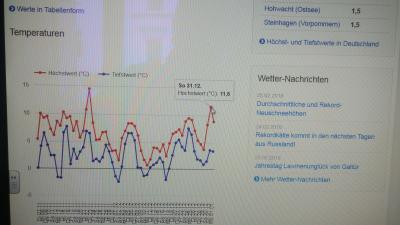
https://www.wetterkontor.de/de/wetter/deutschland/rueckblick.asp?id=80&datum=01.01.2018&t=8
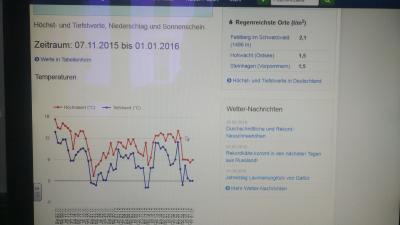
https://www.wetterkontor.de/de/wetter/deutschland/rueckblick.asp?id=80&datum=01.01.2016&t=8
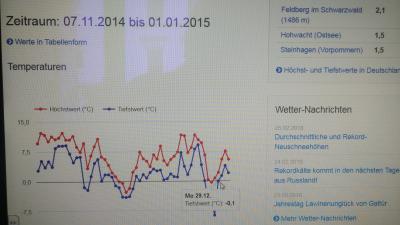
https://www.wetterkontor.de/de/wetter/deutschland/rueckblick.asp?id=80&datum=01.01.2015&t=8
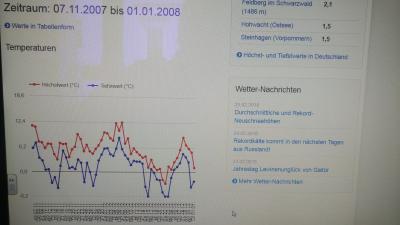
https://www.wetterkontor.de/de/wetter/deutschland/rueckblick.asp?id=80&datum=01.01.2008&t=8
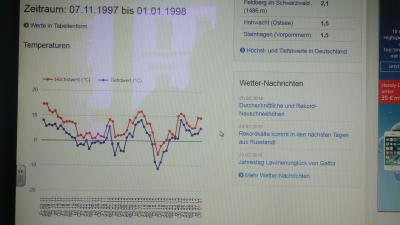
https://www.wetterkontor.de/de/wetter/deutschland/rueckblick.asp?id=80&datum=01.01.1998&t=8
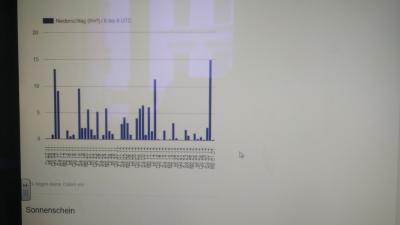
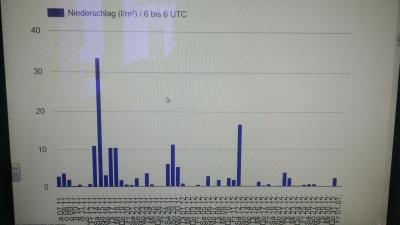
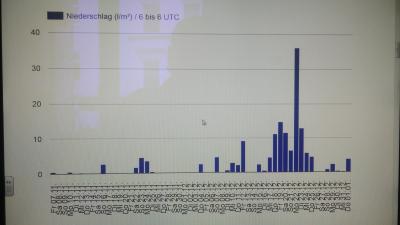
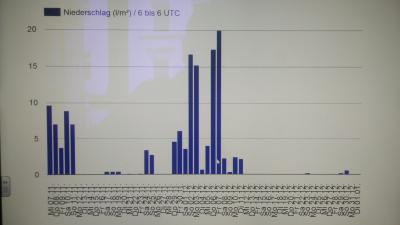
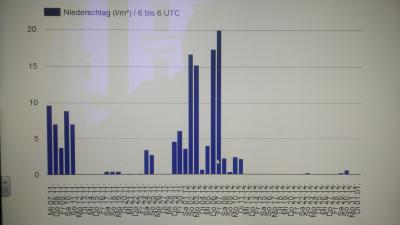
The same phenomenon we can see by the rainy days in Hamburg. In the last twenty years we had regular compresses times and days with high level of the rain. In 1998 we had days with maximum rain with cca 10 Liter per square meter with peaks in three phases in the year. And one day with 14L of rain. In 2008 we have less days of rain (29) in compare to 1998 (31) in the same window of time. But in 2008 there is a highest peak with over 35 Liter per square meter.
In all the twenty years the rain was usually not higher than 10 L per square meter. In year 1998 the rain was around by 6 L and only one day by 12 Liter.
In the last winter we had 42 days of rain in our window of time and five days over or by 10 l per square meter.
Like we can see on the graphic, we had more rain than al the last twenty years or the days with the highest temperatures!
We can see, that the climate is changing.
https://www.wetterkontor.de/de/wetter/deutschland/rueckblick.asp?id=80&datum=01.01.2018&t=8
https://www.wetterkontor.de/de/wetter/deutschland/rueckblick.asp?id=80&datum=01.01.2016&t=8
https://www.wetterkontor.de/de/wetter/deutschland/rueckblick.asp?id=80&datum=01.01.2015&t=8
https://www.wetterkontor.de/de/wetter/deutschland/rueckblick.asp?id=80&datum=01.01.2008&t=8
https://www.wetterkontor.de/de/wetter/deutschland/rueckblick.asp?id=80&datum=01.01.1998&t=8
All the graphics show us, that the average temperature raise up over the years. And the rainy days follows the highest level amount of water.
This climate makes it possible, that pumpkins and vine from Slovenia would also grow in Hamburg.

https://www.wetteronline.de/wetterdaten/hamburg?pcid=pc_rueckblick_data&gid=10147&pid=p_rueckblick_diagram&sid=StationHistory&iid=10147&month=01&year=2018&period=52&metparaid=RR24
The rainfall in this year was very unusual - the temperatures were higher for the December, also comparing with the last year. It`s warmer.


https://www.wetteronline.de/wetterdaten/hamburg?pcid=pc_rueckblick_data&gid=10147&pid=p_rueckblick_diagram&sid=StationHistory&iid=10147&month=01&year=2018&period=52&metparaid=TXLD
The following graphics will show your the temperatures of the last twenty years for the window from 7th of November to the 1st of January. It`s shows the winter from 2017/18, `15/`16, `14/`15,`07/`08 and `97/`98. Two things you will see over the years: The temperature gets more different peaks between high and low temperature per day. The other one is, that the peaks in 1997/98 only have 11 days over 10 degrees and often bellow 0 degree. In 2008 the most of the peaks have over 0 degree and only 16 day bellow. The difference between the highest and the lowest peaks per day are often far apart.
The last days in year 2018 we had a lot of rainy days, that lower the degrees, but we had rarely temperatures bellow 0 degree.

https://www.wetterkontor.de/de/wetter/deutschland/rueckblick.asp?id=80&datum=01.01.2018&t=8

https://www.wetterkontor.de/de/wetter/deutschland/rueckblick.asp?id=80&datum=01.01.2016&t=8

https://www.wetterkontor.de/de/wetter/deutschland/rueckblick.asp?id=80&datum=01.01.2015&t=8

https://www.wetterkontor.de/de/wetter/deutschland/rueckblick.asp?id=80&datum=01.01.2008&t=8

https://www.wetterkontor.de/de/wetter/deutschland/rueckblick.asp?id=80&datum=01.01.1998&t=8
The same phenomenon we can see by the rainy days in Hamburg. In the last twenty years we had regular compresses times and days with high level of the rain. In 1998 we had days with maximum rain with cca 10 Liter per square meter with peaks in three phases in the year. And one day with 14L of rain. In 2008 we have less days of rain (29) in compare to 1998 (31) in the same window of time. But in 2008 there is a highest peak with over 35 Liter per square meter.
In all the twenty years the rain was usually not higher than 10 L per square meter. In year 1998 the rain was around by 6 L and only one day by 12 Liter.
In the last winter we had 42 days of rain in our window of time and five days over or by 10 l per square meter.
Like we can see on the graphic, we had more rain than al the last twenty years or the days with the highest temperatures!
We can see, that the climate is changing.

https://www.wetterkontor.de/de/wetter/deutschland/rueckblick.asp?id=80&datum=01.01.2018&t=8

https://www.wetterkontor.de/de/wetter/deutschland/rueckblick.asp?id=80&datum=01.01.2016&t=8

https://www.wetterkontor.de/de/wetter/deutschland/rueckblick.asp?id=80&datum=01.01.2015&t=8

https://www.wetterkontor.de/de/wetter/deutschland/rueckblick.asp?id=80&datum=01.01.2008&t=8

https://www.wetterkontor.de/de/wetter/deutschland/rueckblick.asp?id=80&datum=01.01.1998&t=8
All the graphics show us, that the average temperature raise up over the years. And the rainy days follows the highest level amount of water.
This climate makes it possible, that pumpkins and vine from Slovenia would also grow in Hamburg.
... link (0 Kommentare) ... comment
Sonntag, 4. Februar 2018
Weather Data
meadowkids.eu, 11:12h
The project will also combine and compare weather conditions in Slovenia (Maribor) and Germany (Hamburg).
Following the weather changes will help us to understand more: (1) how the weather is changing in the last years,
(2) how new weather conditions influence our life and the growth of the plants (pumpkin, potato, apple...),
(3) how different weather conditions also influence the quality and quantity of the plants,
(4) we will also follow different stages of apple tree´s growth (phenological phases) and support our observations with photos.
This part of the project includes the idea of research. Under the theme "Weather Data - Comparison" we will share with you our weather data, growing phases of the apple tree (phenological phases) and our discoveries.
... link (0 Kommentare) ... comment