Mittwoch, 28. Februar 2018
Weather data from the January 2018 in Hamburg-Rissen
meadowkids.eu, 14:27h
The weather data include all Hamburg districts, and also Rissen. The dates are collected in Hamburg, district Fuhlsbüttel.
We´re planing to build our own weather station, but the software is tricky and gave us a lot complications, that is why, we can only use the data from the weather station in Fuhlsbüttel.
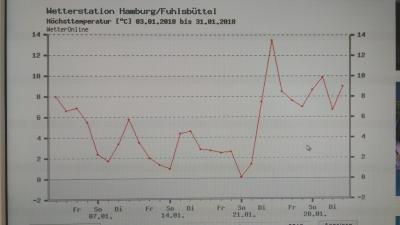
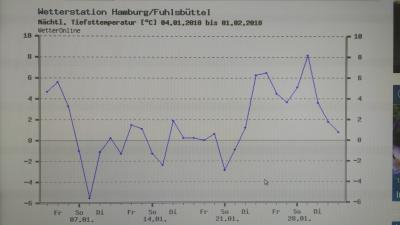
Next graphic show us the data of temperature from January.
The first highest peak follows from the lowest peaks oft the temperature.
https://www.wetteronline.de/wetterdaten/hamburg?pcid=pc_rueckblick_data&gid=10147&pid=p_rueckblick_diagram&sid=StationHistory&iid=10147&month=01&year=2018&period=4&metparaid=RR24
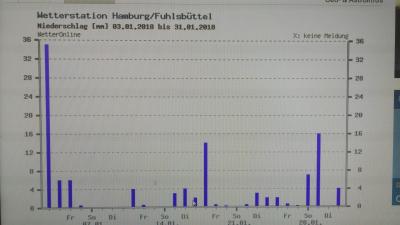
The last graphic shows the peaks of rain in millimetre per square meter.
https://www.wetteronline.de/wetterdaten/hamburg?pcid=pc_rueckblick_data&gid=10147&pid=p_rueckblick_diagram&sid=StationHistory&iid=10147&month=01&year=2018&period=4&metparaid=RR24
If we look at the temperatures, we can see that with the low temperatures also came less rain.
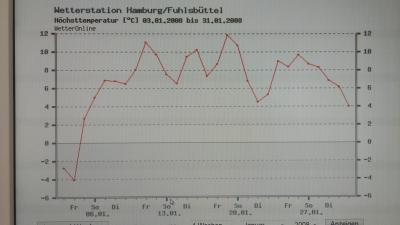
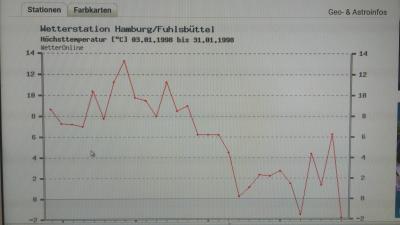
The highest peaks of temperature, compare to January 2018, are 14 degree, in January 2008 are 12 degrees and in 1998 are 13 degrees. The temperature are from year to year raising. The highest temperature in 1998 is on most of the days around 0 degree or bellow it. In the following years the temperatures are going higher.
https://www.wetteronline.de/wetterdaten/hamburg?pcid=pc_rueckblick_data&gid=10147&pid=p_rueckblick_diagram&sid=StationHistory&iid=10147&metparaid=RR24&period=4&month=01&year=2008
https://www.wetteronline.de/wetterdaten/hamburg?pcid=pc_rueckblick_data&gid=10147&pid=p_rueckblick_diagram&sid=StationHistory&iid=10147&metparaid=RR24&period=4&month=01&year=2008
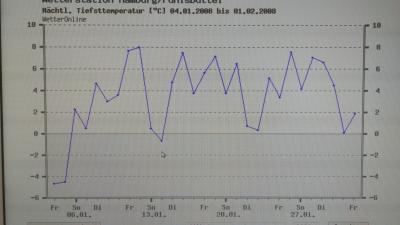
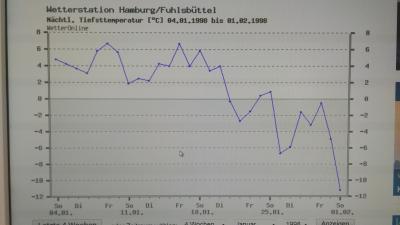
If you look at the night temperature you will see that in January 2018 they lying between + 8 an -6 degree, in January 2008 between +8 and -4 degree an in January +6,5 and -11,5 degree. In the last 20 years the diverenz between the day and night temperature the high degrees take away from the lower degrees. The monthly shape of temperature graded up to 1,5 degree an the lowest by 5,5 degree.
https://www.wetteronline.de/wetterdaten/hamburg?pcid=pc_rueckblick_data&gid=10147&pid=p_rueckblick_diagram&sid=StationHistory&iid=10147&metparaid=RR24&period=4&month=01&year=2008
https://www.wetteronline.de/wetterdaten/hamburg?pcid=pc_rueckblick_data&gid=10147&pid=p_rueckblick_diagram&sid=StationHistory&iid=10147&metparaid=RR24&period=4&month=01&year=1998
https://www.wetteronline.de/wetterdaten/hamburg?pcid=pc_rueckblick_data&gid=10147&pid=p_rueckblick_diagram&sid=StationHistory&iid=10147&metparaid=RR24&period=4&month=01&year=1998
https://www.wetteronline.de/wetterdaten/hamburg?pcid=pc_rueckblick_data&gid=10147&pid=p_rueckblick_diagram&sid=StationHistory&iid=10147&metparaid=RR24&period=4&month=01&year=1998
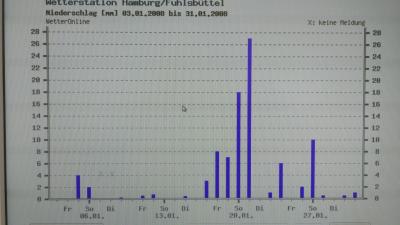
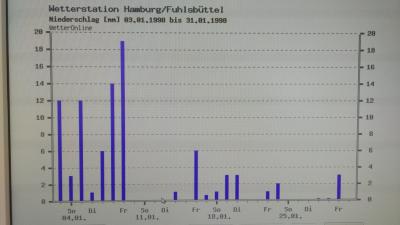
The precipitation show us only small differents. all years have compact a couple of day with precipitations. Ther e is a different between on which days. In the last ten year we get two more days with rain in January. The day with a high level of rain ar between 19 mm per squaremeter and 27mm. Possibly intersting is taht later days in month the precipitation get higher.
Shurely is that it`s was rain because the temperature are higher. Also are the temperature lower there are less decipitations.
We´re planing to build our own weather station, but the software is tricky and gave us a lot complications, that is why, we can only use the data from the weather station in Fuhlsbüttel.
Next graphic show us the data of temperature from January.
The first highest peak follows from the lowest peaks oft the temperature.


https://www.wetteronline.de/wetterdaten/hamburg?pcid=pc_rueckblick_data&gid=10147&pid=p_rueckblick_diagram&sid=StationHistory&iid=10147&month=01&year=2018&period=4&metparaid=RR24
The last graphic shows the peaks of rain in millimetre per square meter.

https://www.wetteronline.de/wetterdaten/hamburg?pcid=pc_rueckblick_data&gid=10147&pid=p_rueckblick_diagram&sid=StationHistory&iid=10147&month=01&year=2018&period=4&metparaid=RR24
If we look at the temperatures, we can see that with the low temperatures also came less rain.
The highest peaks of temperature, compare to January 2018, are 14 degree, in January 2008 are 12 degrees and in 1998 are 13 degrees. The temperature are from year to year raising. The highest temperature in 1998 is on most of the days around 0 degree or bellow it. In the following years the temperatures are going higher.

https://www.wetteronline.de/wetterdaten/hamburg?pcid=pc_rueckblick_data&gid=10147&pid=p_rueckblick_diagram&sid=StationHistory&iid=10147&metparaid=RR24&period=4&month=01&year=2008

https://www.wetteronline.de/wetterdaten/hamburg?pcid=pc_rueckblick_data&gid=10147&pid=p_rueckblick_diagram&sid=StationHistory&iid=10147&metparaid=RR24&period=4&month=01&year=2008
If you look at the night temperature you will see that in January 2018 they lying between + 8 an -6 degree, in January 2008 between +8 and -4 degree an in January +6,5 and -11,5 degree. In the last 20 years the diverenz between the day and night temperature the high degrees take away from the lower degrees. The monthly shape of temperature graded up to 1,5 degree an the lowest by 5,5 degree.

https://www.wetteronline.de/wetterdaten/hamburg?pcid=pc_rueckblick_data&gid=10147&pid=p_rueckblick_diagram&sid=StationHistory&iid=10147&metparaid=RR24&period=4&month=01&year=2008

https://www.wetteronline.de/wetterdaten/hamburg?pcid=pc_rueckblick_data&gid=10147&pid=p_rueckblick_diagram&sid=StationHistory&iid=10147&metparaid=RR24&period=4&month=01&year=1998

https://www.wetteronline.de/wetterdaten/hamburg?pcid=pc_rueckblick_data&gid=10147&pid=p_rueckblick_diagram&sid=StationHistory&iid=10147&metparaid=RR24&period=4&month=01&year=1998

https://www.wetteronline.de/wetterdaten/hamburg?pcid=pc_rueckblick_data&gid=10147&pid=p_rueckblick_diagram&sid=StationHistory&iid=10147&metparaid=RR24&period=4&month=01&year=1998
The precipitation show us only small differents. all years have compact a couple of day with precipitations. Ther e is a different between on which days. In the last ten year we get two more days with rain in January. The day with a high level of rain ar between 19 mm per squaremeter and 27mm. Possibly intersting is taht later days in month the precipitation get higher.
Shurely is that it`s was rain because the temperature are higher. Also are the temperature lower there are less decipitations.
... comment