... newer stories
Montag, 26. Februar 2018
Meteorological report for January
beekids, 18:37h
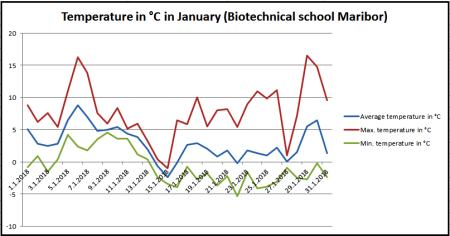
January is the central month of meteorological winter and is usually the coldest month of the year, which was not the case in January 2018, which was the third warmest January since the temperature has been measured in Slovenia. The situation in Maribor was the same, the maximum temperatures reached up to 16 °C.
The average monthly temperature was also significantly higher than the average of the period from 1981 to 2010, it was 2.87 °C and it was 2.97 °C higher than the long-term average. The long-term average for January is - 0.1 °C in Maribor.
In January, the average temperature was only four times below the freezing point (0 °C). Only one day the maximum temperature did not exceed 0 °C. The lowest temperature in January was only - 5.32 °C, and the highest temperature was 16.51 °C.
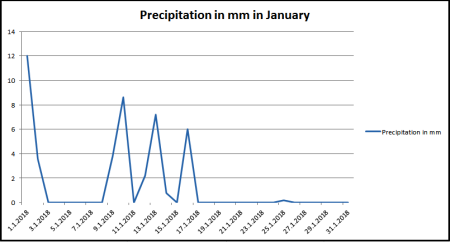
Precipitation data is reversed. Precipitation during January was above average. There were nine rainy days, with 44.4 mm of precipitation, which is 27 % more than the long-term average (35 mm of precipitation). Most precipitation fell on the first day of the year and in the period from 9 to 16 January.
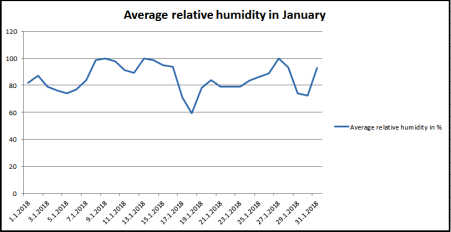
The average relative humidity in January was 85.28 %.
The average monthly temperature was also significantly higher than the average of the period from 1981 to 2010, it was 2.87 °C and it was 2.97 °C higher than the long-term average. The long-term average for January is - 0.1 °C in Maribor.
In January, the average temperature was only four times below the freezing point (0 °C). Only one day the maximum temperature did not exceed 0 °C. The lowest temperature in January was only - 5.32 °C, and the highest temperature was 16.51 °C.
Precipitation data is reversed. Precipitation during January was above average. There were nine rainy days, with 44.4 mm of precipitation, which is 27 % more than the long-term average (35 mm of precipitation). Most precipitation fell on the first day of the year and in the period from 9 to 16 January.
The average relative humidity in January was 85.28 %.
... link (0 Kommentare) ... comment
Meteorological report for Biotechnical School Maribor
beekids, 18:37h
At the school estate, we started observing the weather on 1 January, 2018. The meteorological station is set in the apple orchard in the middle of the school estate. On the southern and eastern side it is closed by blocks of flats, which represent the beginning of the city, and in the north by the hill Kalvarija.
The weather station is type A733 and has a basic set of sensors - sensor for measuring air temperature, relative humidity, precipitation sensor and wetness sensor. From the obtained data we can calculate the average temperature, the highest and the lowest daily temperature, the daily amount of precipitation and the average relative humidity. The data obtained will be compared with the data from the period from 1981 to 2010.
In addition to meteorological data, we will also monitor phenological phases of the plants (fruit trees, pumpkins, potatoes, etc.) and we will also photograph them.
The weather data and phenological phases will also be monitored in Hamburg. Thus, we can compare the development of weather and plants in two completely different locations.
The data will also be presented in graphic form.
We will publish the reports on the blog.
... link (0 Kommentare) ... comment
... older stories